In this section we will talk about the KCO JavaScript API from an analytics point of view. We will learn how to send the events that KCO emits on every step of the purchase funnel to your analytics tool (in this case Google Analytics), in order for you to visualize the entire user journey.
We assume you are already familiar with the KCO JavaScript API, if that is not the case, please go ahead and make yourself familiar with it.
| Event | Meaning |
|---|---|
| load | KCO iframe has been created successfully |
| user_interacted | The user has interacted with the KCO iframe |
| customer | Organization type (B2B or Person) was changed* |
| change | Postal code, country or email was changed* |
| billing_address_change | Billing address was submitted** |
| shipping_address_change | Shipping address was submitted** |
| shipping_option_change | The user has selected a new shipping option** |
| order_total_change | We got changes on the cart from the merchant |
| checkbox_change | A checkbox was checked/unchecked |
| network_error | A network issue has been detected |
| redirect_initiated | The user is about to be redirected to the confirmation page |
| load_confirmation | The confirmation iframe has been created successfully |
- Also triggered on load so you can have the default data for those events.
- Also triggered on load if the user is pre-filled so you can have the default data for those events.
Assuming you already have GA working on your site (if not follow their instructions), we just need to listen to KCO’s events and send them to GA like this:
window._klarnaCheckout(function(api) {
    // register listeners to KCO's events
    api.on({
        // listening to the load event
        'load': function(data) {
            // sending the load event to GA
            gtag('event', 'KCO_load', {
                // adding data we get from KCO
                ...data,
})Let’s break this code down in pieces:
- First, as you may know already, we use the _klarnaCheckout property so we can get the api on the callback.
- Then we use the api.on function passing an object listing the events we want to listen to, in this case only the load event.
- Whenever KCO triggers the load event then we send it to GA using their API, in this case with a prefix KCO_ to make it more clear. We also add the data we get from KCO and we could even add more data if needed you already have from your site, things like currency, language, order lines, etc.
To prevent duplicating this code per event, you could create a function that gets called for each event you have subscribed and then send it to GA, something like this:
const kcoEventsSubscriber = (eventName, data) => {
    gtag('event', `KCO_${eventName}`, {
        ...data,
    })
}

window._klarnaCheckout(function(api) {
    api.on({
        'load': (data) => kcoEventsSubscriber('load', data),
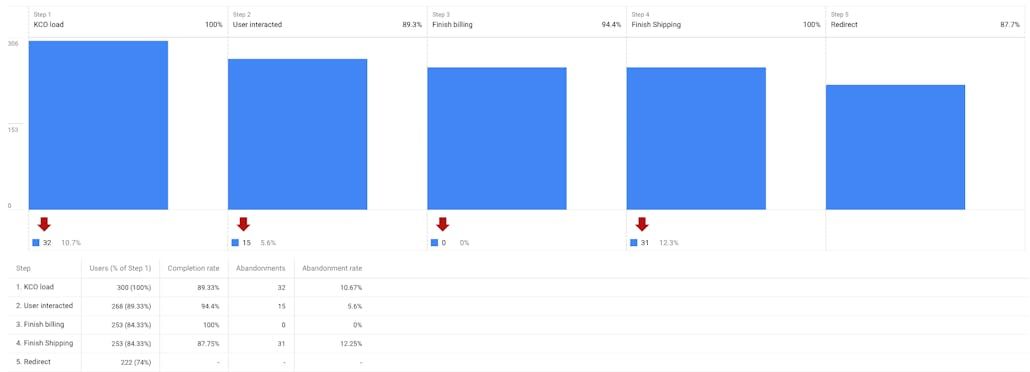
'user_interacted': (data) => kcoEventsSubscriber('user_interacted', data),Let’s see how we can build a funnel analysis in GA. This is a example of what we could create:

Note: this is using data generated automatically by our systems which doesn’t reflect a real user interaction 100%.
For this we used the “Funnel analysis” dashboard under the “Analysis hub” and these events:
- load
- user_interacted
- billing_address_change
- shipping_address_change
- redirect_initiated
Now that you know how send KCO’s events to your analytics tools, go and have fun creating more general or detailed dashboards to understand your users better.